Entries
2024
2023
- 2023-12-25-Energy Innovation
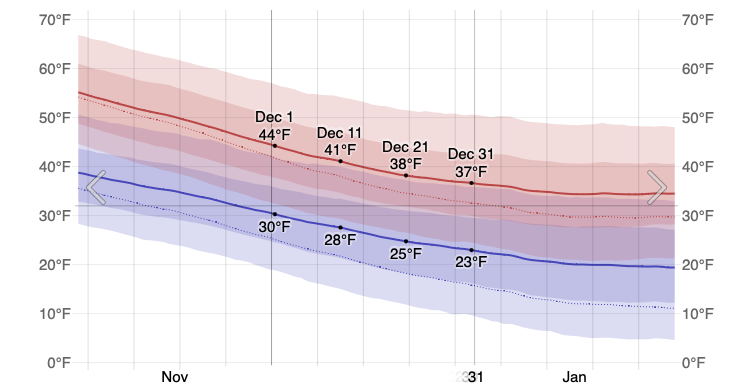
- 2023-12-06-Average December Temperatures for Woodbury
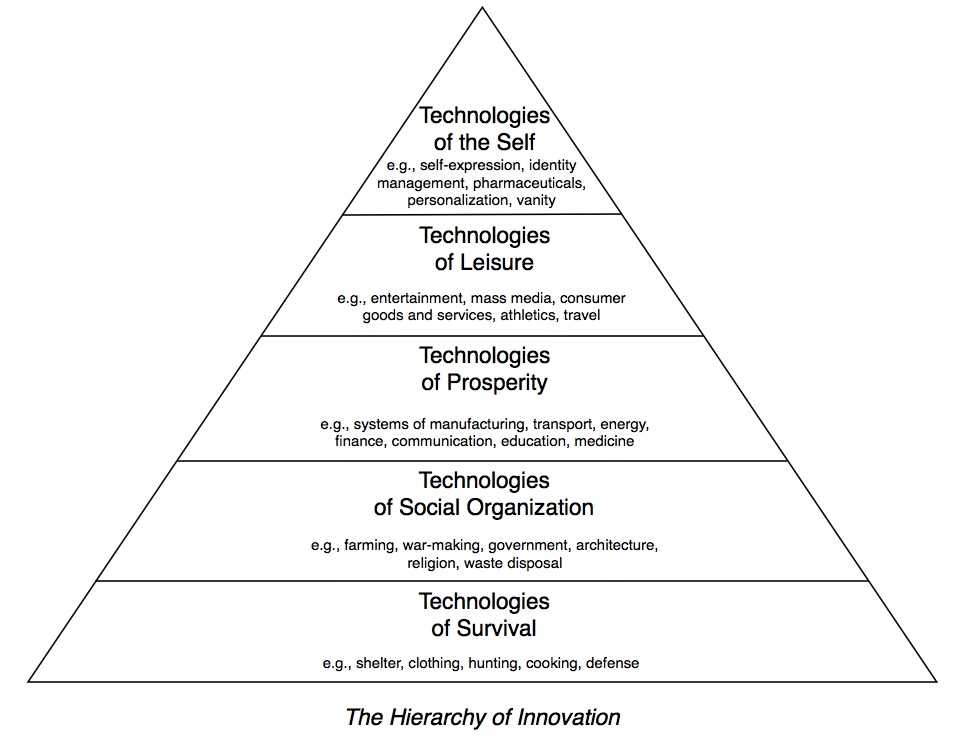
- 2023-08-27-Hierarchy of Innovation
- 2023-07-11-People On the Web
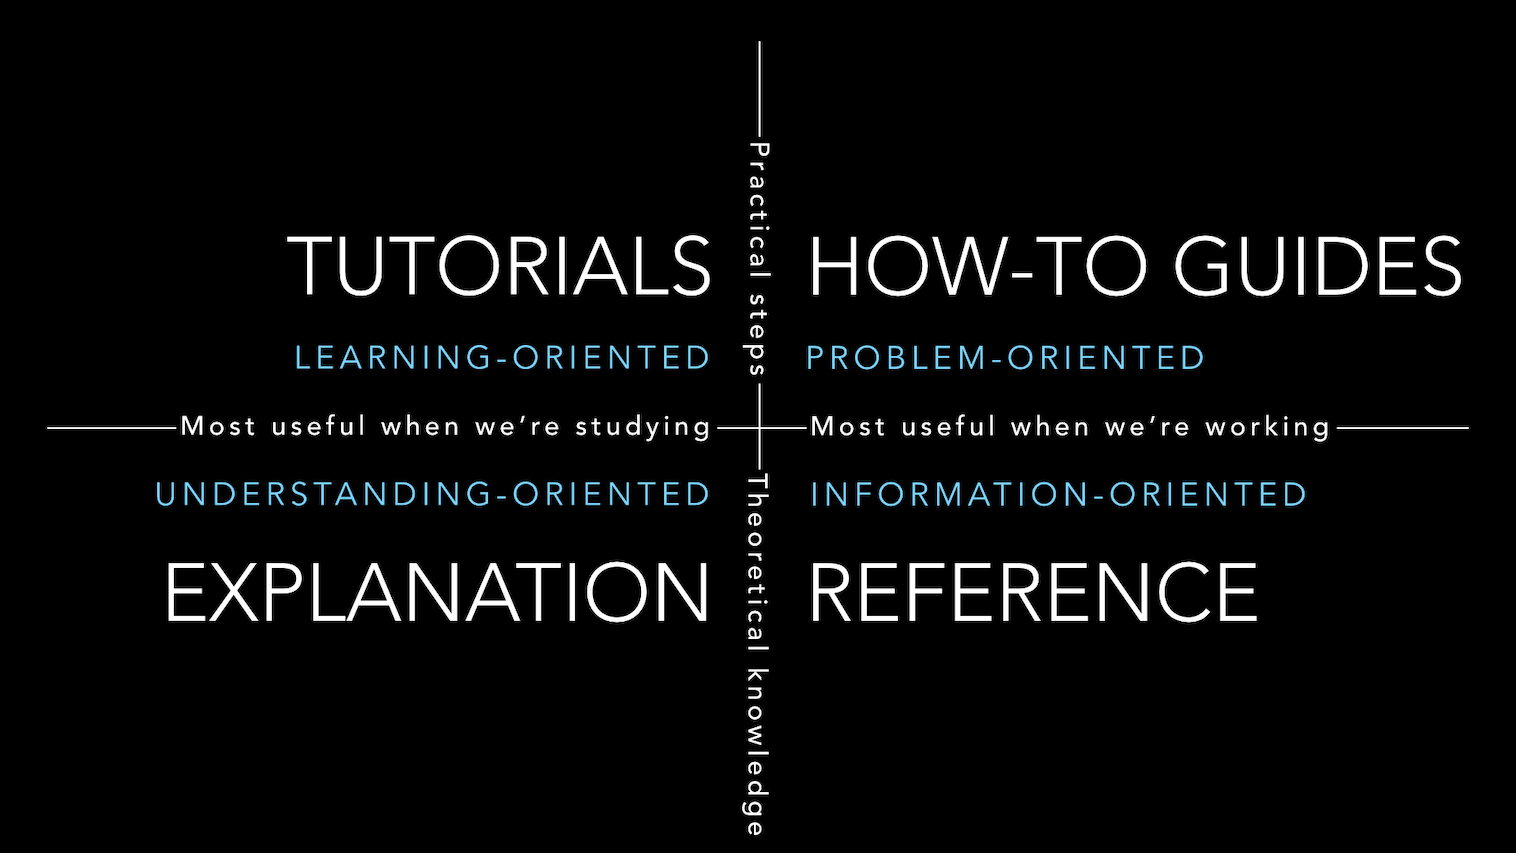
- 2023-07-06-Four Document Structure
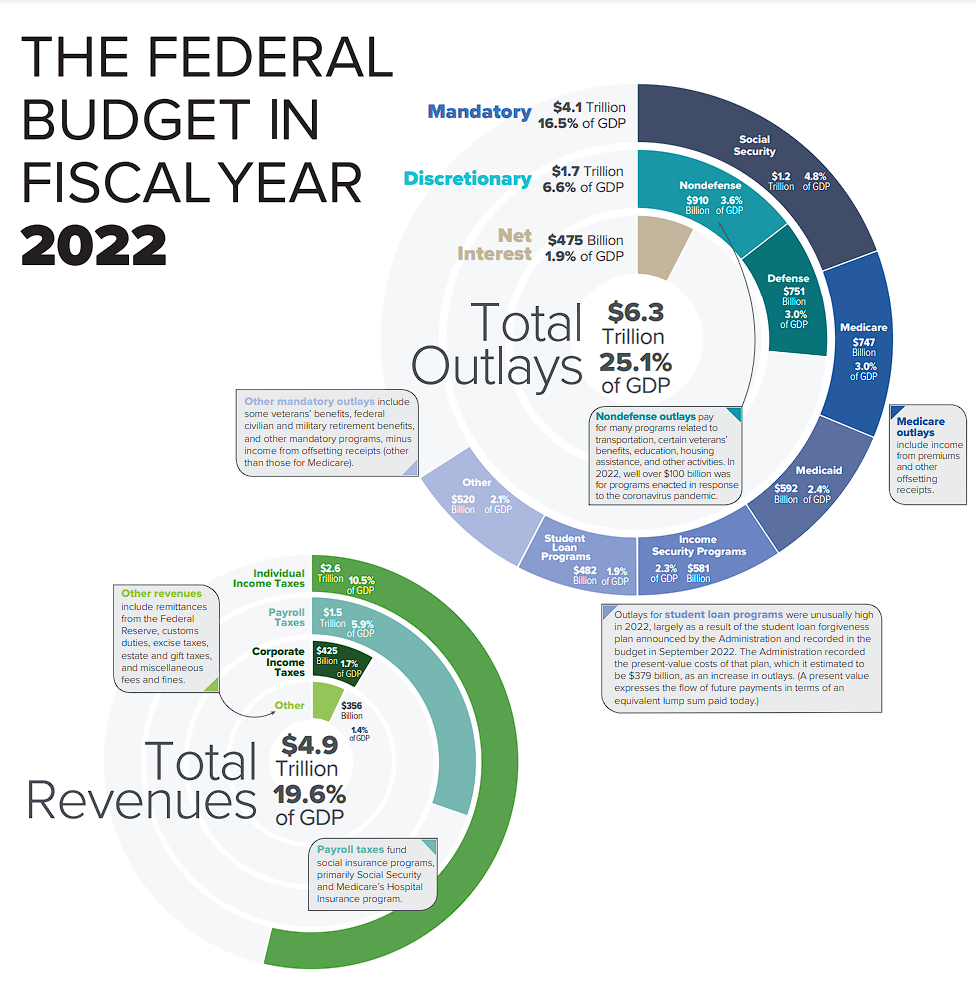
- 2023-06-13-United States Buget - 2022
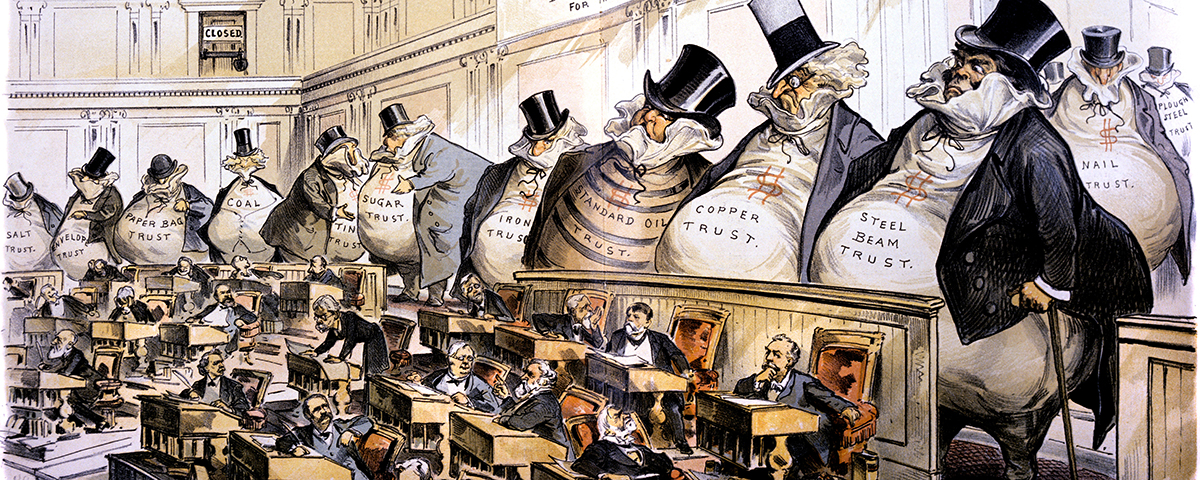
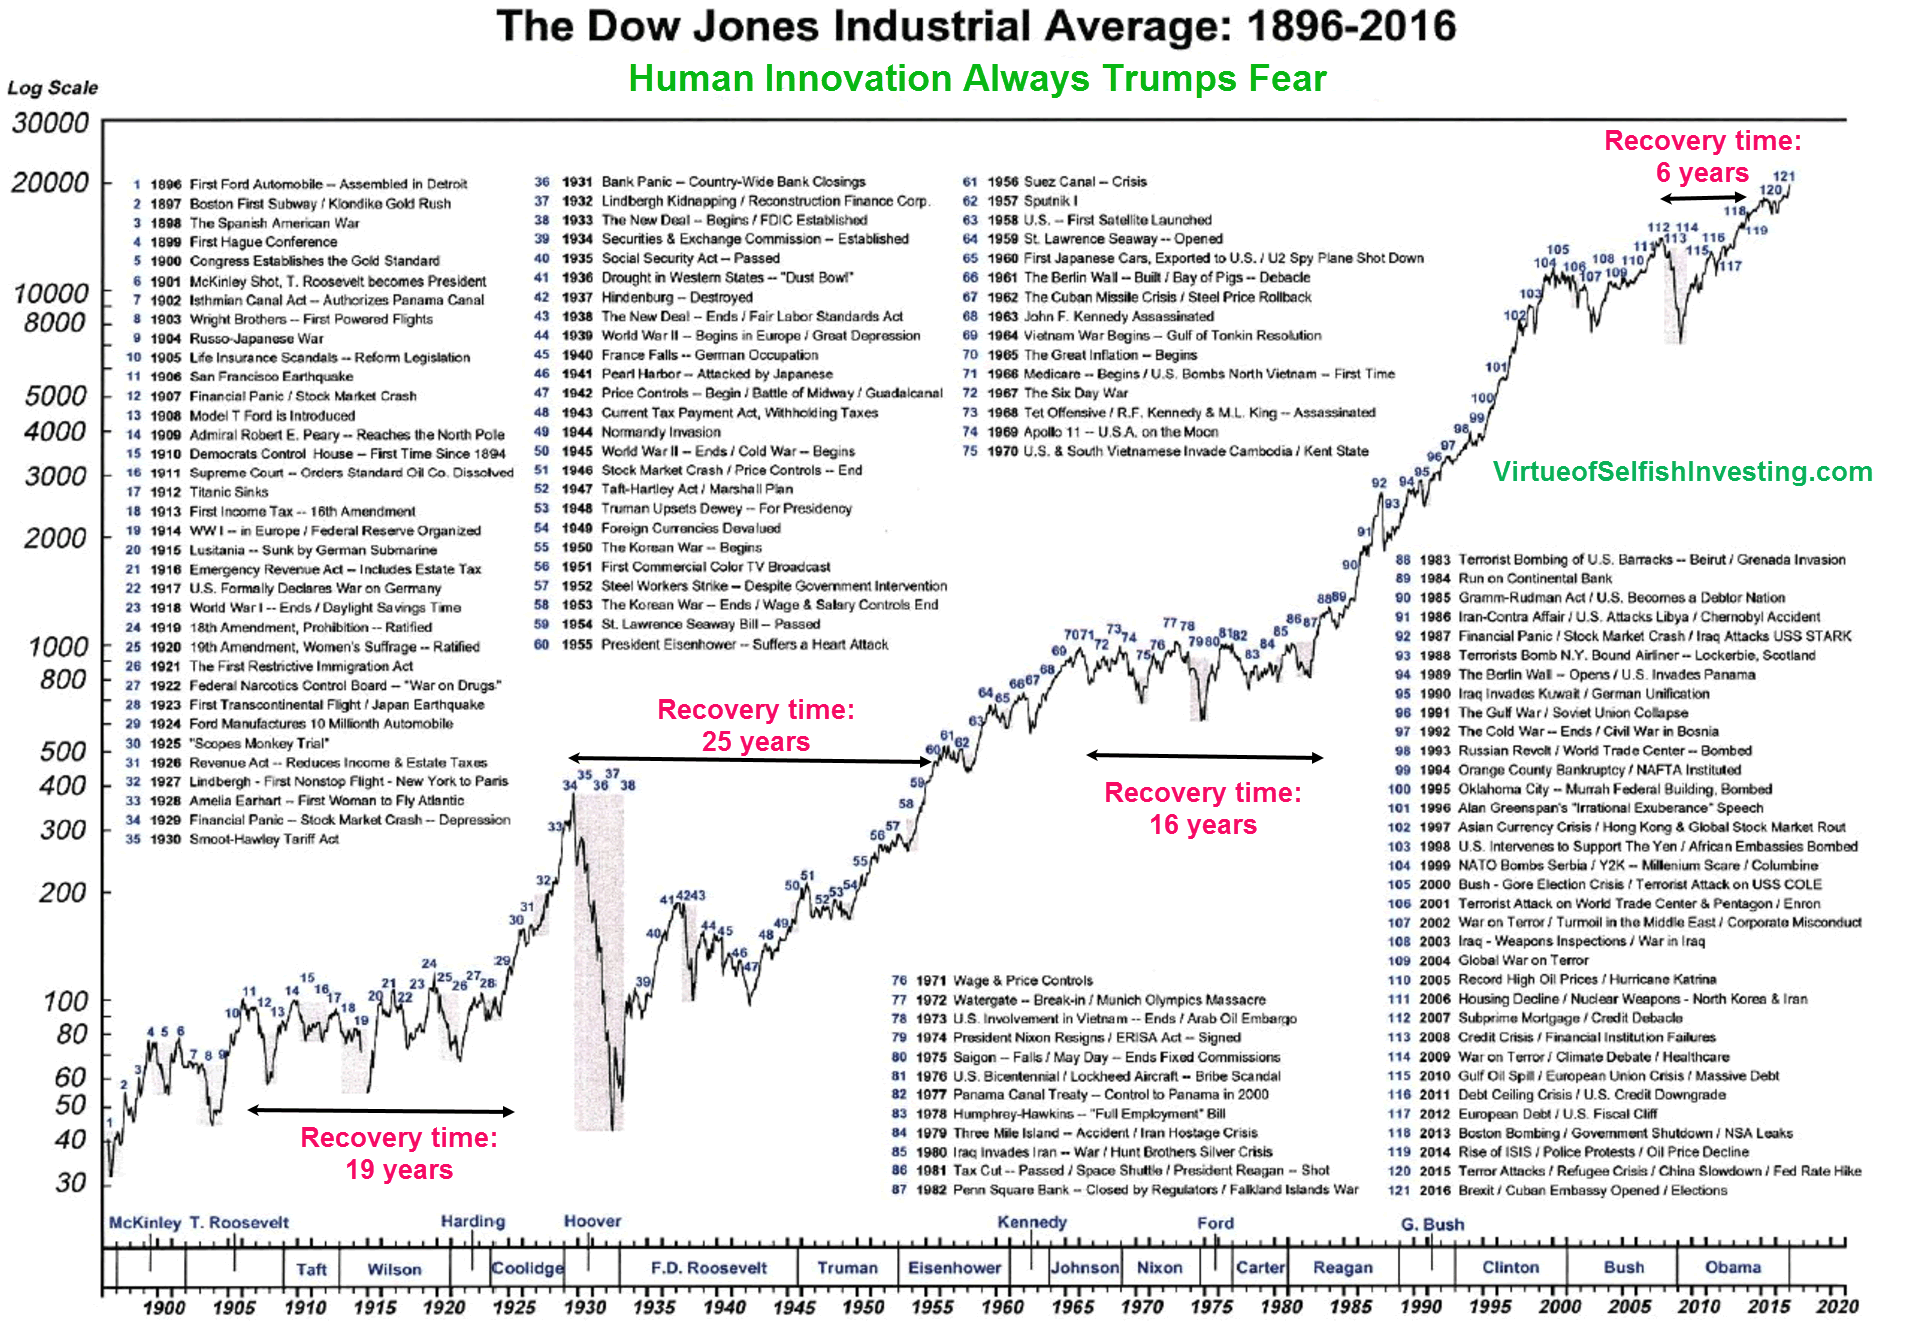
- 2023-04-11-History of the Stock Market
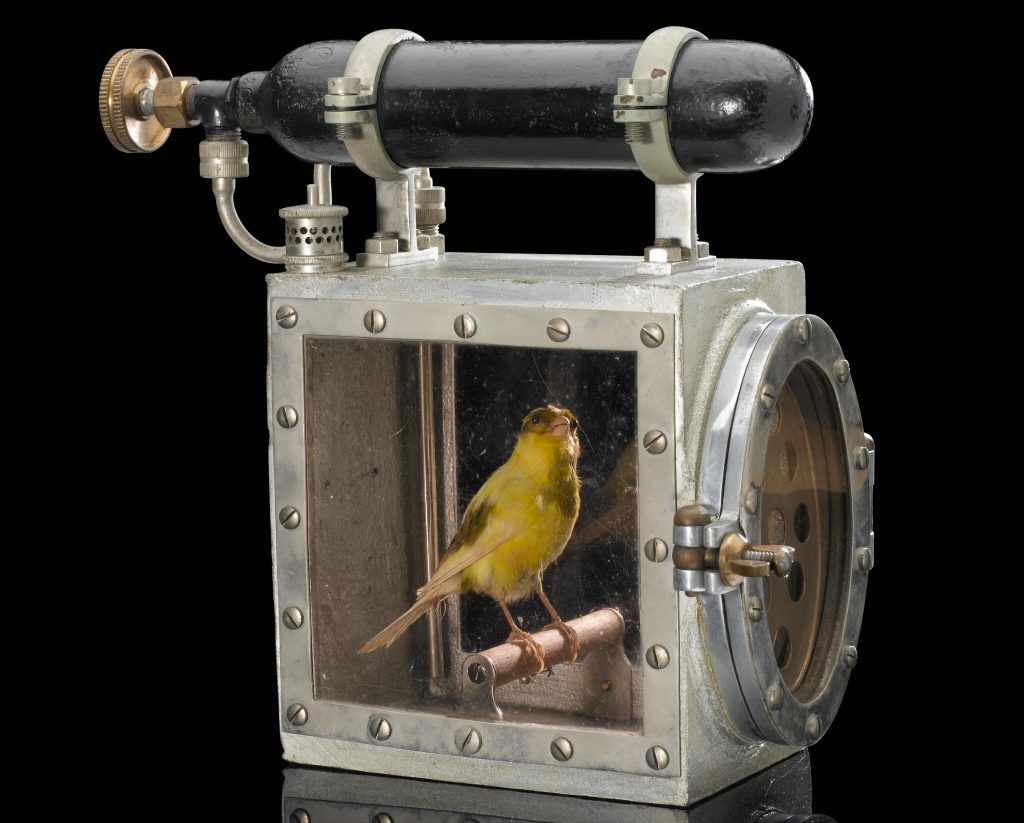
- 2023-01-06-Canary in the Coal Mine
- 2023-01-04-Knowledge Graphs